
Click on the image to access the interactive graphic.
In recent decades, most European countries have attempted to shift the responsibilities of receiving refugees onto their neighbors. In justifying their understanding of an equitable distribution of this responsibility, some have highlighted a country’s size, others its wealth or rates of (un)employment.
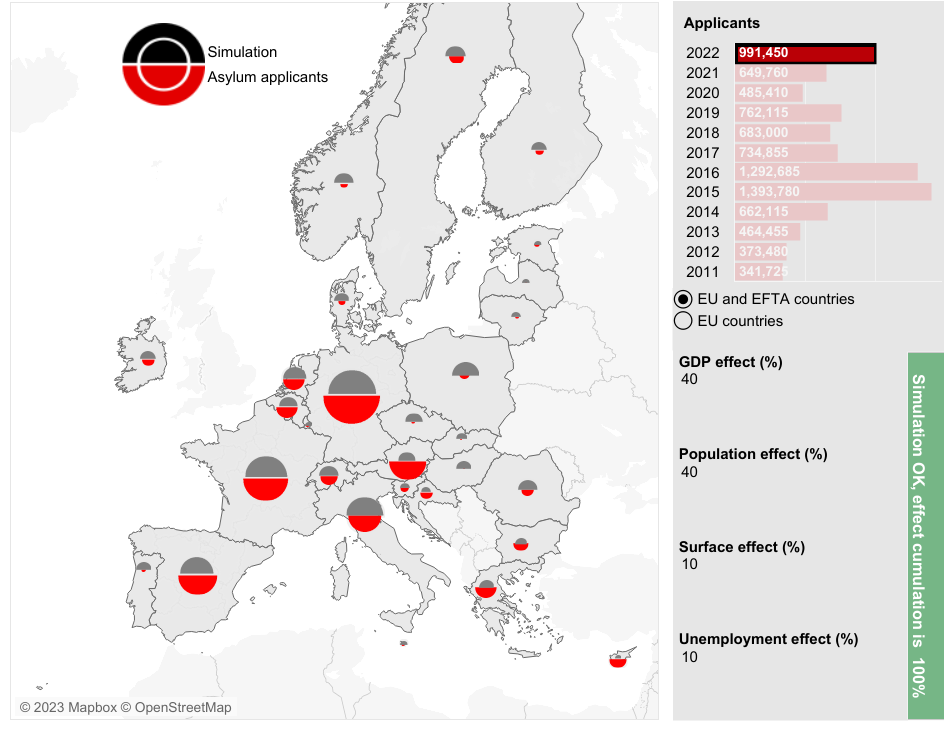
To provide empirical facts for this discussion, this indicator allows to choose and compare the number of asylum seekers received (represented by a red semicircle) with an “equitable” number in proportion to given criteria (represented by a grey semicircle).
In this way, taking into account its population in 2022, Switzerland received “too many” asylum seekers (24,440 instead of 18,507), as did Sweden, Germany, Belgium, France, Spain, Austria, Iceland, Slovenia and especially Malta, Cyprus, and Greece (37,375 instead of 22,990), while Portugal, Denmark, Norway, Italy and all eastern EU countries did not receive “enough”.
On the other hand, considering its gross domestic product (GDP), Switzerland would have had to accept a significantly higher number of refugees (43,246).
The indicator further allows to measure equitable distribution based on geographic area, unemployment rate (inverse proportion), or a combination of the criteria.
If we adopt the weighting suggested in a report by the Mercator Foundation (Angenendt et al. 2013), i.e. 40% for GDP and population and 10% for employment rates and geographic area, we observe that Switzerland received a relatively fair share of asylum seekers in recent years. In 2016, however, in the midst of the Syrian refugee crisis, it should have processed more applications, especially in comparison with Germany.
How many asylum seekers are there in Switzerland?
–
Definitions
Asylum applicant: Asylum applicant refers to a person having submitted an application for international protection or having been included in such an application, as a family member during the reference period.
–
Sources:
– Angenendt, Steffen, Marcus Engler und Jan Schneider (2013). Europäische Flüchtlingspolitik. Wege zu einer fairen Lastenteilung. Berlin: Sachverständigenrat deutscher Stiftungen für Integration und Migration (SVR) Mercator.
– Piguet, Etienne (2014). “Ewropa ta ‘solidarjetà!” ? Pour une répartition équitable des responsabilités. Terra Cognita: Revue suisse de l’intégration et de la migration 25, 46-50.
– Piguet, Etienne (2019). Tool for a More Equitable Distribution of Refugees in Europe. Neuchâtel: nccr – on the move blog.
– Piguet, Etienne (2021). Comment partager la responsabilité de l’asile en Europe ? Asyl, 2021/01: 17–21
– EUROSTAT: Asylum applicants / Population / GDP / Unemployment (all countries except Switzerland)
– OECD: Unemployment rate (only Switzerland)
– World Bank: Surface area.
Note on the methodology: To create a map, select in the “symbolic” pane a year and assign a weight of altogether 100% to one or several criteria. If, for example, the year 2018 and the criteria of geographic area were chosen, the resulting map gives in the red semicircle the actual number of requests for asylum received by a country whereas the grey semicircle gives the number that it should have received given its size in relation to the total geographic area of the EU. France (11% of the EU territory) should have received 73,370 asylum applications (11% of the total) but actually received 119,190 in 2018. Therefore, taking geographic area as the sole distribution key, France received “too many” asylum applications. Choosing another weighting allows combining the effect of population, employment rates, GDP, and geographic area.
Terms of use: The Migration-Mobility Indicators are made available free of charge for non-commercial use. We ask the users to acknowledge the source.
Suggested citation: nccr – on the move, Migration-Mobility Indicators. Neuchâtel: nccr – on the move, 2023.
For more information about the data sets used, please click here.
Last update: 20 June 2023